

by Prof. John Atkinson, City University, London
|
|
| Back to home page | Based on part of the GeotechniCAL
reference package by Prof. John Atkinson, City University, London |
Description of soil is a statement describing the physical nature and state of the soil. It can be a description of a sample, or a soil in situ. It is arrived at using visual examination, simple tests, observation of site conditions, geological history, etc.
Soil classification is the separation of soil into classes or
groups each having similar characteristics and potentially similar behaviour.
A classification for engineering purposes should be based mainly on mechanical
properties, e.g. permeability, stiffness, strength. The class to which
a soil belongs can be used in its description.
Description and classification
 Soils consist of grains (mineral
grains, rock fragments, etc.) with water and air in the voids
between grains. The water and air contents are readily changed by changes in
conditions and location: soils can be perfectly dry (have no water content)
or be fully saturated (have no air content) or be partly saturated (with
both air and water present). Although the size and shape of the
solid (granular) content rarely changes at a given point, they can vary considerably
from point to point.
Soils consist of grains (mineral
grains, rock fragments, etc.) with water and air in the voids
between grains. The water and air contents are readily changed by changes in
conditions and location: soils can be perfectly dry (have no water content)
or be fully saturated (have no air content) or be partly saturated (with
both air and water present). Although the size and shape of the
solid (granular) content rarely changes at a given point, they can vary considerably
from point to point.
First of all, consider soil as a engineering material - it is not a
coherent solid material like steel and concrete, but is a particulate material.
It is important to understand the significance of particle size, shape
and composition, and of a soil's internal structure or fabric.
Basic characteristics of soils
built on: foundations to buildings, bridges.
built in: tunnels, culverts, basements.
built with: roads, runways, embankments, dams.
supported: retaining walls, quays.
Soils may be described in different ways by different people for their different purposes. Engineers' descriptions give engineering terms that will convey some sense of a soil's current state and probable susceptibility to future changes (e.g. in loading, drainage, structure, surface level).
Engineers are primarily interested in a soil's mechanical properties:
strength,
stiffness,
permeability.
These depend primarily on the nature of the soil grains, the current stress,
the water content and unit weight.
Basic characteristics of soils
The range of particle sizes encountered in soil is very large: from boulders with a controlling dimension of over 200mm down to clay particles less than 0.002mm (2mm). Some clays contain particles less than 1 mm in size which behave as colloids, i.e. do not settle in water due solely to gravity.
In theBritish Soil
Classification System, soils are classified into named Basic Soil Type
groups according to size, and the groups further divided into coarse, medium
and fine sub-groups:
|
Very coarse |
BOULDERS | > 200 mm | |
| COBBLES | 60 - 200 mm | ||
|
Coarse |
G |
coarse | 20 - 60 mm |
| medium | 6 - 20 mm | ||
| fine | 2 - 6 mm | ||
|
S |
coarse | 0.6 - 2.0 mm | |
| medium | 0.2 - 0.6 mm | ||
| fine | 0.06 - 0.2 mm | ||
|
Fine |
M |
coarse | 0.02 - 0.06 mm |
| medium | 0.006 - 0.02 mm | ||
| fine | 0.002 - 0.006 mm | ||
|
C CLAY |
< 0.002 mm | ||
SAND (and coarser) particles are visible to the naked eye.
SILT particles become dusty when dry and are easily brushed
off hands and boots.
CLAY particles are greasy and sticky when wet and hard when
dry, and have to be scraped or washed off hands and boots.
Basic characteristics of soils
SANDS include gravelly sands and gravel-sands. Sand grains are generally broken rock particles that have been formed by physical weathering, or they are the resistant components of rocks broken down by chemical weathering. Sand grains generally have a rotund shape.
CLAYS include silty clays and clay-silts; there are few pure silts (e.g. areas formed by windblown Löess). Clay grains are usually the product of chemical weathering or rocks and soils. Clay particles have a flaky shape.
There are major differences in engineering behaviour between SANDS and CLAYS (e.g.
in permeability, compressibility, shrinking/swelling potential). The shape
and size of the soil grains has an important bearing on these differences.
 Click
on a link below to see the shape
Click
on a link below to see the shape
Rounded: Water- or
air-worn; transported sediments
Irregular: Irregular
shape with round edges; glacial sediments (sometimes sub-divided into 'sub-rounded'
and 'sub-angular')
Angular: Flat faces
and sharp edges; residual soils, grits
Flaky: Thickness small
compared to length/breadth; clays
Elongated: Length
larger than breadth/thickness; scree, broken flagstone
Flaky & Elongated:
Length>Breadth>Thickness; broken schists and slates
CLAY particles are flaky. Their thickness is very
small relative to their length & breadth, in some cases as thin as 1/100th
of the length. They therefore have high to very high specific surface values.
These surfaces carry a small negative electrical charge, that will attract
the positive end of water molecules. This charge depends on the soil mineral and
may be affected by an electrolite in the pore water. This
causes some additional forces between the soil grains which are proportional
to the specific surface. Thus a lot of water may be held as
| Therefore | Surface force | µ | 1 |
| self weight forces | d | ||
| Also, specific surface = | area | µ | 1 |
| r * volume | d |
Hence, specific surface is a measure of the relative contributions of surface forces and self-weight forces.
The specific surface of a 1mm cube of quartz (r = 2.65gm/cm³) is 0.00023 m²/N
SAND grains (size 2.0 - 0.06mm) are close to cubes or spheres in shape, and have specific surfaces near the minimum value.
CLAY particles are flaky and have much greater specific surface values.
The
more elongated or flaky a particle is the greater will be its specific
surface.
Click on the following examples:
cubes,
rods,
sheets
Examples of mineral grain specific surfaces:
| Mineral/Soil | Grain width d (mm) | Thickness | Specific Surface m²/N |
|---|---|---|---|
| Quartz grain | 100 | d | 0.0023 |
| Quartz sand | 2.0 - 0.06 | »d | 0.0001 - 0.004 |
| Kaolinite | 2.0 - 0.3 | »0.2d | 2 |
| Illite | 2.0 - 0.2 | »0.1d | 8 |
| Montmorillonite | 1.0 - 0.01 | »0.01d | 80 |
See also clay minerals
Basic characteristics of soils
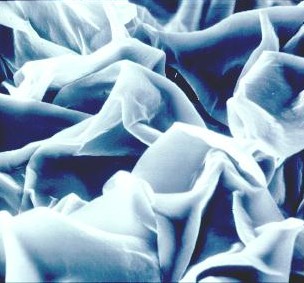
The arrangement and organisation of particles and other features within a soil mass is termed its structure or fabric. This includes bedding orientation, stratification, layer thickness, the occurrence of joints and fissures, the occurrence of voids, artefacts, tree roots and nodules, the presence of cementing or bonding agents between grains.
Structural features can have a major influence on in situ properties.
Description and classification
Origins, formation and mineralogy
igneous rocks
crystalline bodies of cooled magma
e.g. granite, basalt, dolerite, gabbro, syenite, porphyry
sedimentary rocks
layers of consolidated and cemented sediments, mostly formed in bodies
of water (seas, lakes, etc.)
e.g. limestone, sandstones, mudstone, shale, conglomerate
metamorphic rocks
formed by the alteration of existing rocks due to heat from igneous
intrusions (e.g. marble, quartzite, hornfels) or pressure due to crustal
movement (e.g. slate, schist, gneiss).
Origins, formation and mineralogy
Chemical weathering
Chemical weathering occurs in wet and warm conditions and consists of
degradation by decomposition and/or alteration. The results of chemical weathering
are generally fine soils with separate mineral grains, such as
Clays and Clay-Silts. The type of clay mineral depends on the parent rock
and on local drainage. Some minerals, such as quartz, are resistant to
the chemical weathering and remain unchanged.
quartz
A resistant and enduring mineral found in many rocks (e.g. granite,
sandstone). It is the principal constituent of sands and silts, and the
most abundant soil mineral. It occurs as equidimensional hard grains.
haematite
A red iron (ferric) oxide: resistant to change, results from extreme
weathering. It is responsible for the widespread red or pink colouration
in rocks and soils. It can form a cement in rocks, or a duricrust in soils
in arid climates.
micas
Flaky minerals present in many igneous rocks. Some are resistant, e.g.
muscovite; some are broken down, e.g. biotite.
clay minerals
These result mainly from the breakdown of feldspar minerals. They are
very flaky and therefore have very large surface areas. They are major
constituents of clay soils, although clay soil also
contains silt sized particles.
Origins, formation and mineralogy
 size and very flaky in shape.
The key to some of the properties of clay soils, e.g. plasticity, compressibility, swelling/shrinkage potential, lies in the structure of clay minerals.
There are three main groups of clay minerals:
kaolinites
(include kaolinite, dickite and nacrite) formed by the decomposition
of orthoclase feldspar (e.g. in granite); kaolin is the principal constituent
in china clay and ball clay.
illites
(include illite and glauconite) are the commonest clay minerals; formed
by the decomposition of some micas and feldspars; predominant in marine
clays and shales (e.g. London clay, Oxford clay).
montmorillonites
(also called
smectites or fullers' earth minerals) (include calcium and sodium
momtmorillonites, bentonite and vermiculite) formed by the alteration of basic
igneous rocks containing silicates rich in Ca and Mg; weak linkage by cations
(e.g. Na+, Ca++) results in high swelling/shrinking potential
For more information on mineralogy see
http://mineral.gly.bris.ac.uk/mineralogy/
Origins, formation and mineralogy
Transportation
Due to combinations of gravity, flowing water or air, and moving ice. In
water or air: grains become sub-rounded or rounded, grain sizes are sorted,
producing poorly-graded deposits. In moving ice: grinding and crushing
occur, size distribution becomes wider, deposits are well-graded, ranging
from rock flour to boulders.
Deposition
In flowing water, larger particles are deposited as velocity
drops, e.g. gravels in river terraces, sands in floodplains and estuaries, silts
and clays in lakes and seas. In still water: horizontal layers of successive
sediments are formed, which may change with time, even seasonally or daily.
Origins, formation and mineralogy
Loading /unloading history
Initial loading
During deposition the load applied to a layer of soil increases as
more layers are deposited over it; thus, it is compressed and water is squeezed
out; as deposition continues, the soil becomes stiffer and stronger.
Unloading
The principal natural mechanism of unloading is erosion of overlying layers.
Unloading can also occur as overlying ice-sheets and glaciers retreat,
or due to large excavations made by man. Soil expands when it is unloaded,
but not as much as it was initially compressed; thus it stays compressed
- and is said to be overconsolidated. The degree of overconsolidation depends
on the history of loading and unloading.
Drainage history
Chemical changes
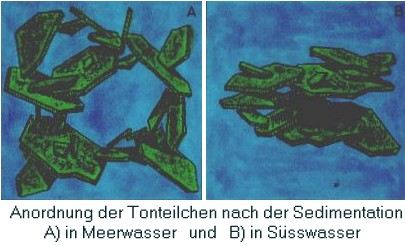
Some soils initially deposited loosely in saline water and then inundated
with fresh water develop weak collapsing structure. In arid climates with
intermittent rainy periods, cycles of wetting and drying can bring minerals
to the surface to form a cemented soil.
Climate changes
Some clays (e.g. montmorillonite clays) are prone to large volume changes due
to wetting and drying; thus, seasonal changes in surface level occur, often
causing foundation damage, especially after exceptionally dry summers. Trees
extract water from soil in the process of evapotranspiration; The soil
near to trees can therefore either shrink as trees grow larger, or expand
following the removal of large trees.
Description and classification
| Very coarse soils |
BOULDERS | > 200 mm | |
| COBBLES | 60 - 200 mm | ||
| Coarse soils |
G GRAVEL |
coarse | 20 - 60 mm |
| medium | 6 - 20 mm | ||
| fine | 2 - 6 mm | ||
| S SAND |
coarse | 0.6 - 2.0 mm | |
| medium | 0.2 - 0.6 mm | ||
| fine | 0.06 - 0.2 mm | ||
 The aim is to measure the distribution
of particle sizes in the sample. When a wide range of sizes is present,
the sample will be sub-divided, and separate tests carried out on each
sub-sample. Full details of tests are given in BS 1377:
"Methods of test for soil for civil engineering purposes".
The aim is to measure the distribution
of particle sizes in the sample. When a wide range of sizes is present,
the sample will be sub-divided, and separate tests carried out on each
sub-sample. Full details of tests are given in BS 1377:
"Methods of test for soil for civil engineering purposes".
Particle-size tests
Wet sieving to separate fine grains from coarse grains is carried
out by washing the soil specimen on a 60mm sieve
mesh.
Dry sieving analyses can only be carried out on particles >
60 mm. Samples (with fines removed) are dried and shaken through a nest
of sieves of descending size.
Sedimentation is used only for fine soils. Soil particles are
allowed to settle from a suspension. The decreasing density of the suspension
is measured at time intervals. Sizes are determined from the settling velocity
and times recorded. Percentages between sizes are determined from density
differences.
Particle-size analysis
The cumulative percentage quantities finer than certain sizes (e.g. passing a given size sieve mesh) are determined by weighing. Points are then plotted of % finer (passing) against log size. A smooth S-shaped curve drawn through these points is called a grading curve. The position and shape of the grading curve determines the soil class. Geometrical grading characteristics can be determined also from the grading curve.
Both the position and the shape of the grading curve for a soil can
aid its identity and description.
Some typical grading curves are shown in the figure:
A - a poorly-graded medium SAND (probably estuarine or flood-plain
alluvium)
B - a well-graded GRAVEL-SAND (i.e. equal amounts of gravel and sand)
C - a gap-graded COBBLES-SAND
D - a sandy SILT (perhaps a deltaic or estuarine silt)
E - a typical silty CLAY (e.g. London clay, Oxford clay)
A grading curve is a useful aid to soil description. Grading curves are often included in ground investigation reports. Results of grading tests can be tabulated using geometric properties of the grading curve. These properties are called grading characteristics
First of all, three points are located on the grading curve:
d10 = the maximum size of the smallest 10% of the sample
d30 = the maximum size of the smallest 30% of the sample
d60 = the maximum size of the smallest 60% of the sample
From these the grading characteristics are calculated:
Effective size
d10
Uniformity coefficient
Cu = d60 / d10
Coefficient of gradation
Ck = d30² / d60 d10
Both Cu and Ck will be 1 for a single-sized soil
Cu > 5 indicates a well-graded soil
Cu < 3 indicates a uniform soil
Ck between 0.5 and 2.0 indicates a well-graded soil
Ck < 0.1 indicates a possible gap-graded soil
| Sieve mesh size (mm) | Mass retained (g) |
Percentage retained |
Percentage finer (passing) |
|---|---|---|---|
| 14.0 | 0 | 0 | 100.0 |
| 10.0 | 3.5 | 1.2 | 98.8 |
| 6.3 | 7.6 | 2.6 | 86.2 |
| 5.0 | 7.0 | 2.4 | 93.8 |
| 3.35 | 14.3 | 4.9 | 88.9 |
| 2.0 | 21.1 | 7.2 | 81.7 |
| 1.18 | 56.7 | 19.4 | 62.3 |
| 0.600 | 73.4 | 25.1 | 37.2 |
| 0.425 | 22.2 | 7.6 | 29.6 |
| 0.300 | 26.9 | 9.2 | 20.4 |
| 0.212 | 18.4 | 6.3 | 14.1 |
| 0.150 | 15.2 | 5.2 | 8.9 |
| 0.063 | 17.5 | 6.0 | 2.9 |
| Pan | 8.5 | 2.9 | |
| TOTAL | 292.3 | 100.0 |
The soil comprises: 18% gravel, 45% coarse sand, 24% medium sand, 10%
fine sand, 3% silt, and is classified therefore as: a well-graded
gravelly SAND
Consistency varies with the water content of the soil. The consistency of a soil can range from (dry) solid to semi-solid to plastic to liquid (wet). The water contents at which the consistency changes from one state to the next are called consistency limits (or Atterberg limits).
Two of these are utilised in the classification of fine soils:
Liquid limit (wL) - change of consistency from plastic
to liquid
Plastic limit (wP) - change of consistency from brittle/crumbly
to plastic
Measures of liquid and plastic limit values can be obtained from laboratory
tests.
The consistency of most soils in the ground will be plastic or semi-solid. Soil strength and stiffness behaviour are related to the range of plastic consistency. The range of water content over which a soil has a plastic consistency is termed the Plasticity Index (IP or PI).
| IP | = liquid limit - plastic limit |
| = wL - wP |
| Low plasticity | wL = < 35% |
| Intermediate plasticity | wL = 35 - 50% |
| High plasticity | wL = 50 - 70% |
| Very high plasticity | wL = 70 - 90% |
| Extremely high plasticity | wL = > 90% |
 A plasticity chart is provided to aid classification.
Activity = IP / (% clay particles)
Some typical values are:
| Mineral | Activity | Soil | Activity |
| Muscovite | 0.25 | Kaolin clay | 0.4-0.5 |
| Kaolinite | 0.40 | Glacial clay and loess | 0.5-0.75 |
| Illite | 0.90 | Most British clays | 0.75-1.25 |
| Montmorillonite | > 1.25 | Organic estuarine clay | > 1.25 |
Specific gravity (Gs) is a property of the mineral or rock
material forming soil grains.
It is defined as
Method of measurement
For fine soils a 50 ml density bottle may be used; for coarse soils
a 500 ml or 1000 ml jar. The jar is weighed empty (M1). A quantity
of dry soil is placed in the jar and the jar weighed (M2). The
jar is filled with water, air removed by stirring, and weighed again (M3).
The jar is emptied, cleaned and refilled with water - and weighed again
(M4).
[The range of Gs for common soils is 2.64 to 2.72]
Description and classification
The volume-weight properties of a soil define its state. Measures of the amount of void space, amount of water and the weight of a unit volume of soil are required in engineering analysis and design.
Soil comprises three constituent phases:
Solid: rock fragments, mineral grains or flakes, organic matter.
Liquid: water, with some dissolved compounds (e.g. salts).
Gas: air or water vapour.
In natural soils the three phases are intermixed. To aid analysis it
is convenient to consider a soil model in which the three phases
are seen as separate, but still in their correct proportions.
The soil model is given dimensional values for the solid, water and
air components: Total volume,
V = Vs + Vw + Va
Since the amounts of both water and air are variable, the volume of solids present is taken as the reference quantity. Thus, the following relational volumetric quantities may be defined:
Note also that:
n = e / (1 + e)
e = n / (1 - n)
v = 1 / (1 - n)
Typical void ratios might be 0.3 (e.g. for a dense, well graded granular
soil) or 1.5 (e.g. for a soft clay).
Volumes of solid, water and air: the soil model
The volume of water in a soil can only vary between zero (i.e. a dry soil) and the volume of voids; this can be expressed as a ratio:
For a perfectly dry soil:
Sr = 0
For a saturated soil:
Sr = 1
Note: In clay soils as the amount water increases the volume
and therefore the volume of voids will also increase, and so the degree
of saturation may remain at Sr = 1 while the actual volume of
water is increasing.
Volumes of solid, water and air: the soil model
The air-voids volume, Va , is that part of the void space not occupied by water.
Va = Vv - Vw
= e - e.Sr
= e.(1 - Sr)
Air-voids content, Av
Av = (air-voids volume) / (total volume)
= Va / V
= e.(1 - Sr) / (1+e)
= n.(1 - Sr)
For a perfectly dry soil:
Av = n
For a saturated soil:
Av =
0
The mass of air may be ignored. The mass of solid particles is usually expressed in terms of their particle density or grain specific gravity.
Grain specific gravity
Hence the mass of solid particles in a soil
Ms = Vs .Gs .rw
(rw = density of water = 1.00Mg/m³)
[Range of Gs for common soils: 2.64-2.72]
Particle density
rs = mass per unit volume of
particles
= Gs .rw
The ratio of the mass of water present to the mass of solid particles is called the water content, or sometimes the moisture content.
From the soil model it can be seen that
w = (Sr .e .rw) /
(Gs .rw)
Giving the useful relationship:
w .Gs = Sr .e
Density is a measure of the quantity of mass in a unit
volume of material.
Unit weight is a measure of the weight of a unit volume
of material.
There are two basic measures of density or unit weight applied to soils: Dry density is a measure of the amount of solid particles per unit volume. Bulk density is a measure of the amount of solid + water per unit volume.
The preferred units of density are:
Mg/m³, kg/m³ or g/ml.
The corresponding unit weights are:
Also, it can be shown that
r = rd(1
+ w) and
g = gd(1 + w)
The water content and unit weight are particularly important, since these could change during transportation and storage.
Some physical state properties are calculated following the practical
measurement of others; e.g. void ratio from porosity, dry unit weight from
unit weight & water content.
Example: A sample of soil was placed in a tin container and weighed, after which it was dried in an oven and then weighed again. Calculate the water content of the soil.
| Weight of tin empty | = 16.16 g |
| Weight of tin + moist soil | = 37.82 g |
| Weight of tin + dry soil | = 34.68 g |
| Water content, w | = (mass of water) / (mass of dry soil) |
| = (37.82 - 34.68) / (34.68 - 16.16) | |
| = 0.169 | |
| Percentage water content | = 16.9 % |
Example
A soil specimen had a volume of 89.13 ml, a mass before drying of 174.45 g and after drying of 158.73 g; the water content
was 9.9 %. Determine the bulk and dry densities and unit weights.
| Bulk density | |
| r | = (mass of specimen) / (volume of specimen) |
| = 174.45 / 89.13 g/ml | |
| = 1.957 Mg/m³ | |
| [1 g/ml = 1 Mg/m³] | |
| Unit weight | |
| g | = 9.81m/s² x r Mg/m³ |
| = 19.20 kN/m³ | |
| Dry density | |
| rd | = (mass after drying) / (volume) |
| = 158.73 / 89.13 | |
| = 1.781 Mg/m³ | |
| rd | = r / (1 + w) |
| = 1.957 / (1+0.099) | |
| = 1.781 Mg/m³ | |
| Dry unit weight | |
| gd | = g / (1 + w) |
| = 19.20 / (1+0.099) | |
| = 17.47 kN/m³ | |
Measurements taken in the field are mostly to determine density/unit weight. The most common application is the determination of the density of rolled and compacted fill, e.g. in road bases, embankments, etc.
Note: These methods are covered in detail by BS1377. You should understand the general principle that density is calculated from the mass and volume of a sample. How a sample of known volume is obtained depends on the nature of the soil. You are not expected to remember the details of each method.
 The core cutter method
This method is suitable for soft fine grained soils. A steel cylinder is driven into the ground, dug out and the soil shaved off level. The mass of soil is found by weighing and deducting the mass of the cylinder. Small samples are taken from both ends and the water content determined. |
 The sand-pouring cylinder method
This method is suitable for stony soils Using a special tray with a hole in the centre, a hole is formed in the soil and the mass of soil removed is weighed. The volume of the hole is calculated from the mass of clean dry running sand required to fill the hole. The sand-pouring cylinder is used to fill the hole in a controlled manner. The mass of sand required to fill the hole is equal to the difference in the weight of the cylinder before and after filling the hole, less an allowance for the sand left in the cone above the hole. |
Bulk density
r = (mass of soil) / (volume of core cutter
or hole)
Description and classification
| Closely packed | ® | Loosely packed |
| Dense | ® | Loose |
| Low water content | ® | High water content |
| Strong and stiff | ® | Weak and soft |
The important indicators of the current state of a soil are:
current stresses: vertical and horizontal effective stresses
current water content: effecting strength and stiffness in fine
soils
liquidity index: indicates state in fine soils
density index: indicates state of compaction in coarse soils
history of loading and unloading: degree of overconsolidation
Engineering operations (e.g. excavation, loading, unloading, compaction,
etc.) on soil bring about changes in its state. Its initial state is the
result of processes of erosion and deposition. It is possible for the engineer
to predict changes that could result from a proposed engineering operation:
changes from the soil's current state to a new future state.
Original deposition
Most
soils are formed in layers or lenses by deposition from moving water, ice or
wind.
One-dimensional compression occurs as overlying layers are added. Vertical and horizontal stresses increase with deposition.
Erosion
Erosion causes
unloading; stresses decrease; some vertical expansion occurs.
Plastic strain has occurred; the soil remains compressed, i.e. overconsolidated.
Subsequent changes
Subsequent changes may occur in the depositional environment: further
loading/unloading due to glaciation, land movement, engineering; and ageing
processes.
Vibration and compaction
Coarse soils can be made more dense by vibration or compaction at essentially
constant effective stress
Creep
Fine soils creep and continue to compress and distort at constant effective
stress after primary consolidation is complete.
Cementing and bonding
Intergranular cementing and bonding occurs due to deposition of minerals
from groundwater, e.g. calcium carbonate; disturbance due to excavation
fractures the bonding and reduces strength.
Weathering
Physical and chemical changes take place in soils near the ground surface
due to the influence of changes in rainfall and temperature.
Changes in salinity
Changes in the salinity of groundwater are due to changes in relative
sea and land levels, thus soil originally deposited in sea water may later
have fresh water in its pores, such soils may be prone to sudden collapse.
It is therefore useful to measure the in situ state and this can be done by comparing the in situ void ratio (e) with the minimum and maximum practical values (emin and emax) to give a density index ID
emin is determined with soil compacted densely in a metal
mould
emax is determined with soil poured loosely into a metal
mould
Density index is also known as relative density
Relative states of compaction are defined:
| Density index | State of compaction |
| 0-15% | Very loose |
| 15-35 | Loose |
| 35-65 | Medium |
| 65-85 | Dense |
| 85-100% | Very dense |
In fine soils, especially clays, the current state is dependent on the water content with respect to the consistency limits (or Atterberg limits). The liquidity index (IL or LI) provides a quantitative measure of the current state:
where
wP = plastic limit and
wL = liquid limit
Significant values of IL indicating the consistency of the
soil are:
IL < 0 Þ semi-plastic solid or solid
0 < IL < 1 Þ plastic
1 < IL Þ liquid
su = 170 exp(-4.6 IL)
kN/m²
[Schofield and Wroth (1968)]
su = (0.11 + 0.37 IP)
s'vo
kN/m²
where s'vo =
vertical effective
stress in situ
[Skempton and Bjerrum (1957)]
Stiffness
The slope of the critical
state line may be estimated from:
l = IP
.Gs / 461
[After Skempton and
Northey (1953)]
The
compressibility
index may be estimated from:
Cc = l ln10 = IP
Gs / 200
(where IP is in percentage units)
Description and classification
BS system for description and classification
compactness
e.g. loose, dense, slightly cemented
bedding structure
e.g. homogeneous or stratified; dip, orientation
discontinuities
spacing of beds, joints, fissures
weathered state
degree of weathering
colour
main body colour, mottling
grading or consistency
e.g. well-graded, poorly-graded; soft, firm, hard
SOIL NAME
e.g. GRAVEL, SAND, SILT, CLAY; (upper case letters) plus silty-, gravelly-,
with-fines, etc. as appropriate
soil class
(BSCS) designation (for roads & airfields) e.g. SW = well-graded
sand
geological stratigraphic name
(when known) e.g. London clay
Not all characteristics are necessarily applicable in every case.
Example:
(i) Loose homogeneous reddish-yellow poorly-graded medium SAND (SP),
Flood plain alluvium
(ii) Dense fissured unweathered greyish-blue firm CLAY. Oxford clay.
BS system for description and classification
Particle shape
angular, sub-angular, sub-rounded, rounded, flat, elongate
Compactness
loose, medium dense, dense (use a pick or driven peg, or
density
index )
Bedding structure
homogeneous, stratified, inter-stratified
Bedding spacing
massive(>2m), thickly bedded (2000-600 mm), medium bedded (600-200
mm), thinly bedded (200-60 mm), very thinly bedded (60-20 mm), laminated
(20-6 mm), thinly laminated (<6 mm).
Discontinuities
i.e. spacing of joints and fissure: very widely spaced(>2m), widely
spaced (2000-600 mm), medium spaced (600-200 mm), closely spaced (200-60
mm), very closely spaced (60-20 mm), extremely closely spaced (<20 mm).
Colours
red, pink, yellow, brown, olive, green, blue, white, grey, black
Consistency
very soft (exudes between fingers), soft (easily mouldable), firm (strong
finger pressure required), stiff (can be indented with fingers, but not
moulded) very stiff (indented by sharp object), hard (difficult to indent).
Grading
well graded (wide size range), uniform (very narrow size range), poorly
graded (narrow or uneven size range).
Composite soils
In SANDS and GRAVELS: slightly clayey or silty (<5%), clayey
or silty (5-15%), very clayey or silty(>15%)
In CLAYS and SILTS: sandy or gravelly (35-65%)
BS system for description and classification
| Soil group | Symbol | Recommended name | ||
| Coarse soils | Fines % | |||
| GRAVEL | G | GW | 0 - 5 | Well-graded GRAVEL |
| GPu/GPg | 0 - 5 | Uniform/poorly-graded GRAVEL | ||
| G-F | GWM/GWC | 5 - 15 | Well-graded silty/clayey GRAVEL | |
| GPM/GPC | 5 - 15 | Poorly graded silty/clayey GRAVEL | ||
| GF | GML, GMI... | 15 - 35 | Very silty GRAVEL [plasticity sub-group...] | |
| GCL, GCI... | 15 - 35 | Very clayey GRAVEL [..symbols as below] | ||
| SAND | S | SW | 0 - 5 | Well-graded SAND |
| SPu/SPg | 0 - 5 | Uniform/poorly-graded SAND | ||
| S-F | SWM/SWC | 5 - 15 | Well-graded silty/clayey SAND | |
| GPM/GPC | 5 - 15 | Poorly graded silty/clayey SAND | ||
| SF | SML, SMI... | 15 - 35 | Very silty SAND [plasticity sub-group...] | |
| SCL, SCI... | 15 - 35 | Very clayey SAND [..symbols as below] | ||
| Fine soils | >35% fines | Liquid limit% | ||
| SILT | M | MG | Gravelly SILT | |
| MS | Sandy SILT | |||
| ML, MI... | [Plasticity subdivisions as for CLAY] | |||
| CLAY | C | CG | Gravelly CLAY | |
| CS | Sandy CLAY | |||
| CL | <35 | CLAY of low plasticity | ||
| CI | 35 - 50 | CLAY of intermediate plasticity | ||
| CH | 50 - 70 | CLAY of high plasticity | ||
| CV | 70 - 90 | CLAY of very high plasticity | ||
| CE | >90 | CLAY of extremely high plasticity | ||
| Organic soils | O | [Add letter 'O' to group symbol] | ||
| Peat | Pt | [Soil predominantly fibrous and organic] |
![]()