A half-closed layer, a permeable layer either above or below (d
= H)
Vertical sand drains, horizontal drainage (d = L/2)
Back to
One-dimensional consolidation theory
Solution using parabolic isochrones
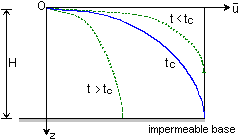 Isochrones can be approximated to
parabolas, affording reasonably accurate solutions to the differential equation
for one-dimensional consolidation. Solutions must be obtained for two separate,
but adjoining, cases:
· When the elapsed time (t) is less than the critical time (tc)
· When the elapsed time (t) is greater than the critical time
(tc)
The critical time is the time that must elapse before the excess
pore pressures at the impermeable base first begin to dissipate.
Back to Solution using
parabolic isochrones
Solution for t < tc case
 Putting time factor

and average degree of consolidation,

the general solution is

This is valid for 0 < t < tc
At t = tc, n = H = 
Giving

and
Ut = 0.3333
Back to Solution using
parabolic isochrones
Solution for t > tc case
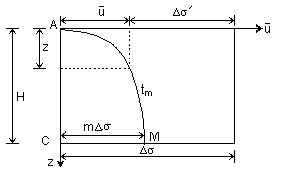 Putting time factor

and average degree of consolidation,

the general solution is

This is valid for tc < t < t¥
At t = tc, n = H = 
Giving

and
Ut = 0.3333
Back to Consolidation
The oedometer test
The one-dimensional compression and swelling characteristics of a soil may
be measured in the laboratory using the oedometer test (from the
Greek: oidema = a swelling).
A cylindrical specimen of soil enclosed in a metal ring is subjected to
a series of increasing static loads, while changes in thickness are recorded
against time.
From the changes in thickness at the end of each load stage the compressibility
of the soil may be observed, and parameters measured such as Compression
Index (Cc) and Coefficient of Volume Compressibility (mv).
From the changes in thickness recorded against time during a load stage
the rate of consolidation may be observed and the coefficient
of consolidation (cv) measured.
The test is fully detailed in BS 1377.
Back to The oedometer test
Apparatus and procedure
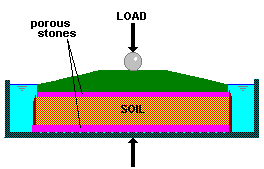 The saturated specimen is usually
75 mm diameter and 15-20 mm thick, enclosed in a circular metal ring and
sandwiched between porous stones.
Vertical static load increments are applied at regular time intervals
(e.g. 12, 24, 48 hr.). The load is doubled with each increment up to the
required maximum (e.g. 25, 50, 100, 200, 400, 800 kPa). During each load
stage thickness changes are recorded against time.
After full consolidation is reached under the final load, the loads are
removed (in one or several stages - to a low nominal value close to zero)
and the specimen allowed to swell, after which the specimen is removed
and its thickness and water content determined. With a porous stone both
above and below the soil specimen the drainage will be two-way
(i.e. an open layer in which the drainage path length, d = H/2)
Back to Consolidation
Determination of cv from test results
The recorded thickness changes during one of the load stages in an oedometer
test are used to evaluate the coefficient of consolidation (cv).
The procedure involves plotting thickness changes (i.e. settlement) against
a suitable function of time [either Ötime or log(time)] and then fitting
to this the theoretical Tv:Ut curve.
In this way known intercepts of Tv:Ut are located
from which cv may be calculated.
Back to Determination of cv
from test results
The Root-Time method
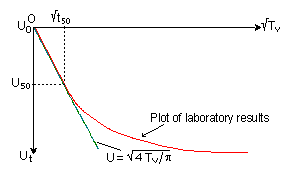 The first portion of the curve
of settlement against Ötime is approximately a straight line. The U0
(Ut = 0) point is located at the intercept with the Ut
axis. A second point is required: suppose this is U90/Öt90
(point C). The location of this point depends on the equation for the curved
portion [See curve fitting methods: Terzaghi or parabolic isochrones]. Once
U90 has been located other values follow since the Ut
axis scale is linear. The coefficient of consolidation is therefore:

where d = drainage path length
[d = H for one-way drainage, d = H/2 for two-way drainage]
Other appropriate time-interval values could be used:
e.g. U50, ÖT50, Öt50 , etc.
Back to The Root-Time method
Curve fitting based on Terzaghi's equation
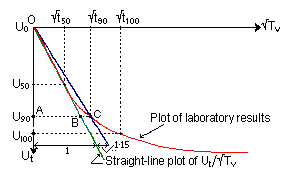 From Terzaghi’s analysis, the straight-line
portion is:
For 0 < Ut < 0.6,

On the straight line:
ÖT90 = AB = 0.9 x Ö(p/4)
= 0.7976
On the curved portion:
ÖT90 = AC = Ö0.848 = 0.9209
Thus, a line drawn through points O and C has abscissae 1.15 times greater
than those of the straight line (OB). [0.9209/0.7976 = 1.15]
After the laboratory results curve has been plotted, line OB is drawn,
followed by line OC: this crosses the laboratory curve at point (ÖT90,U90)
and locates Öt90
The coefficient of consolidation is therefore:

Back to The Root-Time method
Curve fitting based on parabolic isochrones
 From the parabola equation the
straight-line portion is:
For 0 < Ut < 0.333,

On the straight line:
ÖT90 = AB = 0.9 x Ö(3/4) = 0.7794
On the curved portion:
ÖT90 = AC = Ö0.716 = 0.8462
Thus, a line drawn through points O and C has abscissae 1.086 times greater
than those of the straight line (OB). [0.8462/0.7794 = 1.086]
After the laboratory results curve has been plotted, line OB is drawn,
followed by line OC: this crosses the laboratory curve at point (ÖT90,U90)
and locates Öt90
The coefficient of consolidation is therefore:

Back to Determination of cv
from test results
The Log-Time method
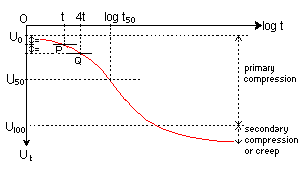 An alternative to the Root-Time
method, that is particularly useful when there is significant secondary
compression (creep). The Uo point is located by selected two
points on the curve for which the times (t) are in the ratio 1:4, e.g. 1
min and 4 min; or 2 min and 8 min.; the vertical intervals AP and PQ will
be equal.
The U100 point can be located in the final part of the curve
flattens sufficiently (i.e. no secondary compression). When there is significant
secondary compression, U100 may be located at the intercept of
straight line drawn through the middle and final portions of the curve.
Now U50 and log t50 can be located.
The coefficient of consolidation is therefore:

Back to Consolidation
Calculation of settlement times
After the coefficient of consolidation (cv) has been determined
from laboratory data calculations are possible for site settlements. It
is important to note that cv is not a constant, but varies
with both the level of stress and degree of consolidation. For practical
site settlement calculations, however, it is sufficiently accurate to measure
cv relative to the loading range applicable on site and then
assume this value to be approximately constant for all degrees of consolidation
(except for very low values).
The basic equation used is:

where d = drainage path length
[d = H for one-way drainage, d = H/2 for two-way drainage]
Tv and t are coupled to a given degree of consolidation
Back to Calculation of settlement
times
Prediction of time for given settlement
Example
The final consolidation settlement of a layer of clay 5.0 m thick is
calculated to be 280mm. The coefficient of consolidation for the loading
range is 0.955 mm²/min. There is two-way drainage, upward and downward.
Calculate the time required for (a) 90% consolidation settlement, (b)
a settlement of 100 mm.
(a) Drainage path length, d = 5.0/2 = 2.50 m = 2500 mm
For U90, T90 = 0.848. Then

(b) For 100 mm settlement, Ut = 100/280 = 0.357
and since Ut < 0.6, Tv = 0.357² x p/4
= 0.100
Then time for 100mm settlement

Back to Calculation of settlement
times
Prediction of settlement amount at given time
Example
A layer of clay has a thickness of 4.0 m and drains both upward and downward.
A laboratory test has yielded a coefficient of consolidation for the appropriate
loading range of 0.675 mm²/min. The final consolidation settlement
has been calculated to be 120mm. Provide estimates of the consolidation
settlement that may be expected 1yr, 2yr, 5yr and 10yr after construction.
Drainage path length, d = 2000 mm
When Ut < 0.6, use Ut = Ö(4Tv/p)
When Ut > 0.6,

cv = 0.645 mm²/min = 928.8 mm²/day
time t
(years) |
time t
(days) |
Tv
= cvt/d² |
Ut
(<0.6) |
Ut
(>0.6) |
rc (mm)
at time t |
| 1 |
365 |
0.0848 |
0.328 |
|
39 |
| 2 |
730 |
0.1965 |
0.465 |
|
56 |
| 5 |
1825 |
0.4238 |
0.735 |
0.715 |
86 |
| 10 |
3650 |
0.8475 |
|
0.900 |
108 |
| 23.6 |
8613 |
2.0 |
|
0.994 |
119 |
Back to Consolidation
Reliability for design purposes
Laboratory measurements of stress-strain parameters (Cc, Cs,
mv) are generally acceptable, provided sampling quality is good,
e.g. minimal disturbance, valid representation of strata, maintenance of
structure and water content, careful preparation, etc.
Measurements of strain/time relationships (cv) and permeability
(k) are not so reliable.
Observed rates of settlement are generally greater than values based on
oedometer test results.
Reliability is compromised by factors such anisotropy (e.g. silt/sand layers,
varves, fissures, etc), presence of roots, organic matter and voids, and
also the effects of secondary compression.
Loads are not often applied instantaneously, and so due allowance should
be for the gradual application of loading.
Back to Consolidation
Secondary compression or creep
In some soils (especially recent organic soils) one-dimensional compression
continues under constant loading after all of the excess pore pressure has
dissipated, i.e. after primary consolidation has ceased - this is called
secondary compression or creep.
It is generally thought that creep is due to changes in soil structure,
although no reliable theory has been proposed as yet.
It is likely that some creep is occurring due primary consolidation, affecting
the linearity of the r/Ötime curve and thus making the accurate prediction
of settlement difficult and possibly unreliable.
For practical purposes, the Log-Time plot (described elsewhere) can be used
to estimate a coefficient of secondary compression (Ca).
Back to Secondary compression
or creep
Coefficient of secondary compression
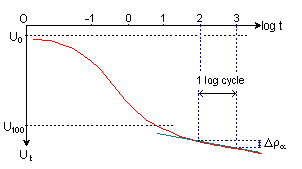 The amount of secondary compression
is the settlement occurring after t100, i.e. after full
dissipation of excess pressures
= ra (or sa).
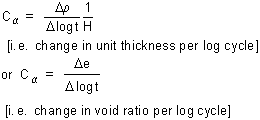
The r/log t curve after t100 can be
approximated to a straight line, the slope of which gives the coefficient
of secondary compression (Ca).
The slope of the laboratory curve is measured over one log-time cycle, e.g.1000
to 10000 mins.
Back to Secondary compression
or creep
Overconsolidation due to creep
Creep (secondary compression) is basically similar to compaction, except
it takes place slowly.
The result of creep is a change in volume (also water content and void ratio).
The soil is in effect further consolidated, and therefore if unloaded is
left overconsolidated.
The phenomenon of overconsolidation due to creep is noticeable in soft clays.
 )
)
 = u - uo
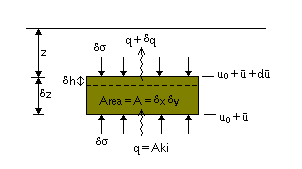
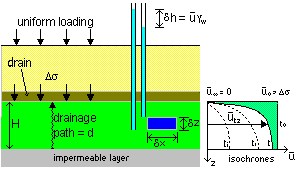 A simple one-dimensional
consolidation model consists of rectilinear element of soil subject to vertical
changes in loading and through which vertical (only) seepage flow is taking place.


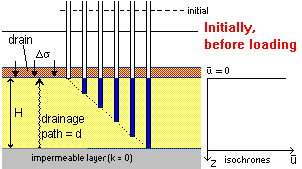 Immediately
after the loading is applied the standpipes will each show an initial
excess pore pressure of
 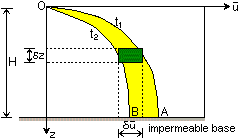 The gradient of an isochrone is related to the hydraulic gradient (i):


 During consolidation
water escapes from the soil to the surface or to a permeable sub-surface
layer above or below (where
 Isochrones can be approximated to
parabolas, affording reasonably accurate solutions to the differential equation
for one-dimensional consolidation. Solutions must be obtained for two separate,
but adjoining, cases:
  Putting time factor


 Putting time factor

 The saturated specimen is usually
75 mm diameter and 15-20 mm thick, enclosed in a circular metal ring and
sandwiched between porous stones.
 The first portion of the curve
of settlement against Ötime is approximately a straight line. The U0
(Ut = 0) point is located at the intercept with the Ut
axis. A second point is required: suppose this is U90/Öt90
(point C). The location of this point depends on the equation for the curved
portion [See curve fitting methods: Terzaghi or parabolic isochrones]. Once
U90 has been located other values follow since the Ut
axis scale is linear. The coefficient of consolidation is therefore:

 From Terzaghi’s analysis, the straight-line
portion is:


 An alternative to the Root-Time
method, that is particularly useful when there is significant secondary
compression (creep). The Uo point is located by selected two
points on the curve for which the times (t) are in the ratio 1:4, e.g. 1
min and 4 min; or 2 min and 8 min.; the vertical intervals AP and PQ will
be equal.


 The amount of secondary compression
is the settlement occurring after t100, i.e. after full
dissipation of excess pressures